Industry Analysis
The Industry Group Analysis module studies the breadth in the underlying industry groups and thus provide a reading of the strength of the current market trend, and its likely duration.Â
Our report provides:
- confirmation – whether the industry group breadth status supports the current market trend.
- early warning – extreme readings amongst a majority of groups helps identify potential market turning points.
- industry focus – which groups look set to outperform.
Determining industry breadth
We use two principal indicators to measure industry breadth:
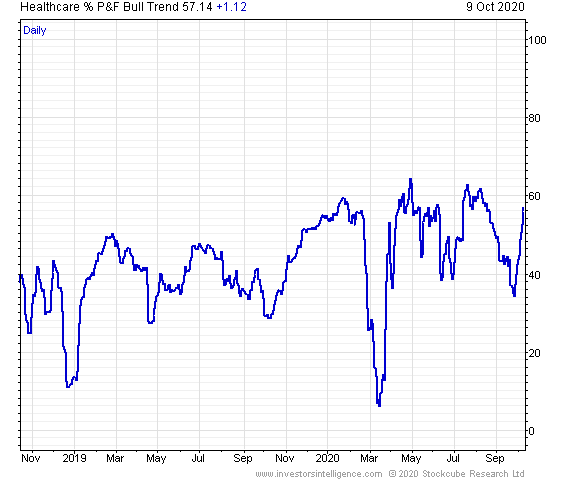
- The Industry Group Bullish %
This indicator measures the number of bull trends amongst the 196 IBD narrow industry groups. It is a confirming rather than a leading indicator. - The Sector Sum indicator
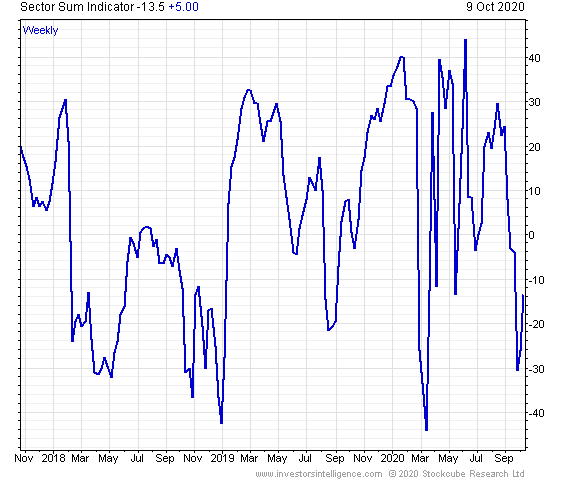
This indicator measures the number of bull trends amongst the 45 broad industry groups. It is calculated using a scoring system rather than as a breadth percentage.
Using the Indicators
Important signals are generated when the indicators change directions at extremes.

Reversals from high levels are bearish for the market.
Upturns from the lows are bullish for the market.
Identifying industry turning points and trends
Â
We seek to identify turning points in Industry trends through analysis of extreme readings at an Industry level using our industry group bullish percentage indicator.

| We also suggest suitable stocks and funds to benefit from such anticipated moves. | Â |
The Industry Bell CurveÂ
Each of the broad industry groups is mapped according to its current bullish % breadth reading and is assigned a + or – sign depending if it is in an up or down column on the p&f chart.
 We use the bell curve to see the general movement of industries in the market, taking particular note of whether individual industries are either overbought or oversold and whether all industries become strongly positive or strongly negative, which might signal a general trend change in the market.Â
Â

